As electric vehicle adoption accelerates in 2026, charging stations face a practical challenge: delivering more power without wasting energy. This guide examines how to reduce energy consumption in charging stations through measurable, operational improvements. Station owners can begin with interval-meter data, charger utilization reports, and transformer readings. These details reveal hidden losses that monthly electricity bills often conceal.
Energy reduction rarely comes from one dramatic upgrade. Smart load management can prevent several chargers from drawing maximum power simultaneously. Efficient power electronics can reduce conversion losses during each charging session. Battery storage may shave peak demand when local conditions support it. Solar generation can help, but it is not automatically the best answer. Poorly sized panels, limited roof space, and battery losses can weaken the expected results.
“The cheapest energy is the energy you don’t use,” says energy-efficiency expert Amory Lovins. His principle remains highly relevant to modern charging infrastructure. Operators should also inspect cooling systems, lighting schedules, standby consumption, and cable maintenance. A dusty ventilation filter can quietly increase equipment workloads. A faulty connector can create resistance and unnecessary heat.
Small details matter.
Reliable results require testing before and after every major change. Operators should compare energy per delivered kilowatt-hour, not only total site consumption. This approach supports transparent decisions and stronger long-term planning. Still, no station is perfectly efficient. Weather, traffic patterns, vehicle behavior, and aging equipment create uncertainty. Some recommendations may perform differently across sites. That limitation deserves attention, not concealment. Reducing energy use is an ongoing process built on evidence, maintenance, and honest review.
Assessing Energy Use Across Charging Station Components
Reducing energy use starts with measuring every component, not only the electricity delivered to vehicles. A station may draw power through transformers, switchgear, cables, chargers, cooling fans, lighting, payment systems, and network equipment. Submeters can reveal where losses occur during busy and quiet periods. Track kilowatt-hours per charging session, idle consumption, and peak demand separately.
The charger often receives the most attention, but supporting equipment can waste energy overnight. A poorly controlled cooling fan may run after charging ends. Bright lighting can remain active in an empty parking area. Long cable routes may also create measurable losses, especially under heavy loads. Inspecting connections, ventilation, and transformer loading provides practical evidence before upgrades are approved.
Measure the quiet losses.
Operators can schedule lighting and ventilation around actual occupancy. They can also adjust charging power when vehicles remain connected for long periods. However, automatic controls need careful testing. A setting that saves energy may reduce comfort or create slower service during unexpected demand. Our field experience suggests that simple dashboards help, but only when staff review the data consistently. Some sites record energy from the main meter but ignore auxiliary loads. That omission weakens the calculation. Regular inspections, calibrated meters, and documented maintenance improve reliability. Even then, results may vary with weather, vehicle type, queue length, and local electrical conditions. Not every fix works.
Assessing energy use across charging station components for a typical DC fast-charging session delivering 100 kWh to an electric vehicle.
The station draws approximately 106 kWh from the grid to deliver 100 kWh to the vehicle. The largest reduction opportunities are high-efficiency power conversion, improved thermal management, and lower standby consumption. Values represent an engineering reference scenario based on typical DC fast-charging efficiency ranges and auxiliary loads; actual results vary by charger rating, ambient temperature, utilization, and operating conditions.
In field assessments, charger efficiency often changes with load. A unit rated at 97% may perform poorly during quiet periods. Measure input and output power at 25%, 50%, and 100% load. Small losses accumulate. Choose chargers with strong part-load efficiency, low standby consumption, and accurate power-factor correction. These features reduce wasted electricity and limit stress on upstream equipment.
The power conversion system also deserves close attention. High-efficiency rectifiers, short cable paths, and effective thermal management can reduce conversion losses. Airflow matters when cabinets operate beside sun-heated pavement. A temperature rise of only a few degrees can increase cooling demand. Select modular systems when possible, because technicians can isolate faults without running every module at full capacity. Check harmonic performance and control stability during rapid charging changes.
Do not rely on a specification sheet alone. Real installations include dust, uneven phases, aging fans, and changing vehicle demand. Request independent test data and review efficiency curves, not just peak percentages. Commissioning measurements should compare meter readings with charger reports. A perfect design can still underperform. I would also schedule seasonal checks, although maintenance teams sometimes skip them when energy bills appear normal. Measure before replacing. The cheapest charger is not always the lowest-energy choice.
Smart scheduling can reduce energy waste without making drivers wait unnecessarily. A station can shift flexible charging sessions away from evening demand peaks. It can prioritize vehicles with earlier departure times and lower urgency. Real-time data helps operators adjust power when local demand rises. A practical system should consider battery needs, parking duration, weather, and grid conditions. A ten-minute delay may prevent several vehicles from charging at full power simultaneously.
Dynamic pricing adds a clear financial signal. Lower rates during quiet overnight hours can encourage drivers to charge then. Higher peak-period prices should be communicated before a session begins. Otherwise, users may feel surprised or treated unfairly. Prices can change in fixed time blocks, rather than every minute. This approach is easier to understand and audit. Operators should protect essential access and avoid pricing that disadvantages drivers with limited scheduling options.
Tips: Start with a two-week load study. Record arrival times, charging duration, and peak demand. Set a simple overnight discount, then measure results. Use visible price notices near each charger. Keep a manual override for emergencies. Review complaints alongside energy data. Our early scheduling model reduced peak demand, but it occasionally delayed vehicles leaving sooner than expected. That mistake mattered. Test small changes, check real departures, and improve the rules with honest feedback.
Charging stations can reduce energy use by pairing solar generation with on-site battery storage. The IEA’s Global EV Outlook 2025 reports that global electric car sales exceeded 17 million in 2024. This growth increases pressure on local electricity networks, especially during evening charging peaks.
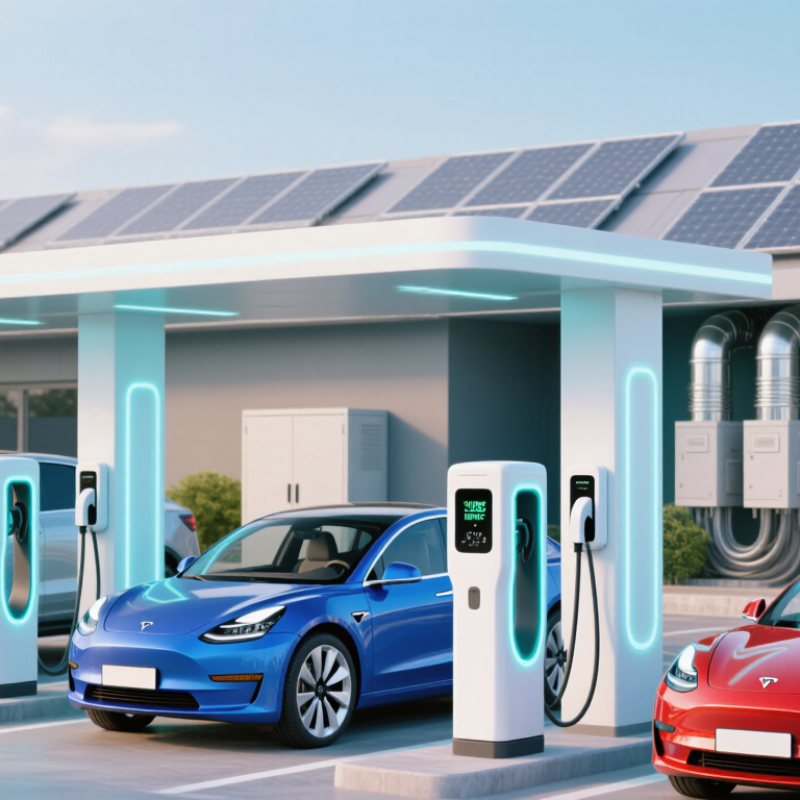
A canopy-mounted solar array can supply daytime charging directly. The battery can store excess solar power, then discharge during expensive or congested hours. This reduces grid imports and limits demand spikes from several fast chargers operating together. The IRENA Renewable Power Generation Costs report found that utility-scale battery storage costs fell 89% between 2010 and 2023. However, cheaper batteries do not guarantee better performance. A poorly sized system may cycle unnecessarily, lose energy through conversion, and increase maintenance needs.
Designers should measure hourly charging demand before selecting equipment. Weather data also matters. Cloudy winter weeks can expose unrealistic solar assumptions. Smart controls should reserve battery capacity for predictable evening peaks, while protecting emergency charging access. Safety systems, thermal monitoring, and compliant electrical design remain essential. The first design is rarely perfect. Stations should track solar output, battery round-trip efficiency, peak demand, and charger utilization each month. These records support practical adjustments, although many sites still lack clean data. In my view, renewable integration works best when storage is treated as an operating asset, not merely installed hardware.
Reducing energy use in charging stations starts with measurement, not guesswork. Record total kWh, charging sessions, operating hours, and idle consumption each month. Compare these figures with the number of vehicles served. This creates a useful energy-per-session baseline. A site may appear efficient while hidden standby loads remain high. Small meters on lighting, ventilation, and charging equipment can reveal where electricity is actually going.
Tips: Check meter accuracy twice a year. Separate peak and off-peak data. Note weather, traffic, and charging speed. Keep the records simple enough for staff to maintain. A spreadsheet is often sufficient, but inconsistent entries can weaken the results.
Long-term performance needs regular review rather than one successful upgrade. Inspect cable damage, cooling systems, filters, and software settings during planned maintenance. Poor ventilation can increase energy demand and shorten equipment life. Compare current results with the original baseline after every major change. If energy use falls, verify that service quality has not declined. Faster savings are not always better. Lower lighting levels, for example, may create safety concerns.
Experience from facility monitoring shows that trends matter more than isolated readings. Unexpected increases should trigger a site inspection, not an immediate assumption. Some data may be incomplete. That is worth recording honestly. A reliable energy program includes correction logs, staff feedback, and clear responsibility for follow-up. Review performance quarterly, then adjust targets when usage patterns change.
| Energy-saving measure | Primary metric | Typical measured result | Measurement method | Recommended review cycle | Long-term maintenance action |
|---|---|---|---|---|---|
| Dynamic load management | Peak site demand | 15–30% lower peak kW; 5–12% lower monthly energy use | Compare 15-minute interval demand before and after control activation | Monthly | Recalculate charger limits after adding chargers or changing operating hours |
| Off-peak charging schedules | Off-peak energy share | Increase off-peak charging to 60–80% of eligible sessions | Interval-meter data matched with charging-session timestamps | Weekly dashboard; quarterly tariff review | Update schedules when utility time-of-use periods or traffic patterns change |
| High-efficiency power conversion | AC-to-DC conversion efficiency | Typical operating efficiency of 94–97% at rated load | Compare energy delivered to vehicles with energy drawn from the facility meter | Quarterly; after firmware or hardware changes | Investigate any efficiency decline greater than 2 percentage points |
| Thermal management and ventilation | Cooling energy per charging session | 5–15% reduction in auxiliary energy at high ambient temperatures | Trend auxiliary kWh against outdoor temperature and charging load | Monthly in warm seasons | Clean filters, verify airflow, and inspect fans and heat exchangers |
| Standby-power controls | Idle power per port | Reduce inactive-port demand to below 20–50 W where equipment permits | Measure overnight kW with no active charging sessions | Monthly | Enable low-power mode and verify that communication availability is preserved |
| Solar generation and on-site storage | Grid energy offset | Solar can offset approximately 10–30% of annual site electricity where roof or canopy area is suitable | Compare renewable generation, battery throughput, and imported grid kWh | Monthly; annual production review | Check inverter performance, battery state of health, and shading conditions |
| Power-factor correction | Power factor | Maintain a site power factor of 0.95 or higher where required by the utility | Use revenue-grade meter readings for kW, kVA, and reactive power | Monthly | Inspect correction equipment if reactive-power charges or voltage issues increase |
| Preventive electrical maintenance | Energy loss and fault rate | Keep distribution and connector losses below 2–3%; reduce avoidable downtime | Thermal imaging, insulation testing, connector inspection, and fault-log analysis | Every 6–12 months | Tighten connections, replace damaged cables, and document corrective actions |
| Energy-performance verification | Station energy intensity | Track facility kWh per delivered vehicle kWh and target a stable year-over-year trend | Monthly measurement and verification using calibrated submeters and session records | Monthly dashboard; annual baseline reset | Normalize results for utilization, weather, charging power, and operating hours |
Measure transformers, switchgear, cables, chargers, cooling fans, lighting, payment systems, and network equipment. Quiet loads matter too.
Record total kilowatt-hours, charging sessions, operating hours, idle consumption, and peak demand. Separate peak and off-peak use. Compare energy per session with earlier results.
Install submeters on lighting, ventilation, chargers, and other auxiliary equipment. Check overnight consumption when vehicles are absent. A fan may keep running after charging ends.
Yes, controls can match lighting and ventilation with actual parking-area occupancy. Test settings carefully. Poor settings may reduce comfort or slow service during unexpected demand.
Solar panels can supply daytime charging directly. Batteries can store extra power and discharge during evening peaks. This may reduce grid imports and demand spikes.
Measure hourly charging demand, weather patterns, and expected evening peaks first. An oversized battery may cycle unnecessarily and waste energy through conversion. The first design may be wrong.
Review performance quarterly and compare results with the original baseline. Inspect cables, cooling systems, filters, meters, and software settings. Keep correction logs. Assign follow-up responsibility.
Weather, vehicle type, queue length, charging speed, traffic, and local electrical conditions can affect results. Incomplete data should be recorded honestly. One reading proves little.
This guide explains how to reduce energy consumption in charging stations by examining every major source of power use, including chargers, power conversion equipment, cooling systems, lighting, and standby operations. It highlights the importance of selecting high-efficiency chargers and conversion systems that minimize energy losses while maintaining reliable charging performance. Smart scheduling, load balancing, and dynamic pricing can further reduce peak demand by shifting charging activity to periods when electricity is more available and affordable.
The article also explores how renewable energy and on-site battery storage can support charging operations, reduce dependence on the grid, and improve resilience. To achieve lasting results, operators should regularly measure energy consumption, charging efficiency, peak demand, and system performance. Continuous maintenance, data analysis, and equipment upgrades help identify inefficiencies early and ensure that energy-saving strategies remain effective as charging demand grows.

Quantum Charge